Wednesday, July 30, 2008
at
16:23
|
There was nothing happening on Tuesday so let's talk about Wednesday. 1. Wednesday, July 30th, 2008 (8:15 a.m. New York Time) USA At 8:15 a.m. we will have US ADP Employment Change. I think when it deviates a quite bit, it may actually move the market well. If it comes out at 0 or higher, I would buy USD/JPY or sell EUR/USD and I would expect 40 pips price action. If it comes out at -120 K or more negative, I would sell USD/JPY or buy EUR/USD and expect 40 pips move. You may try less conservative triggers but then it may be more risky to trade. 2. Wednesday, July 30th, 2008 (9:30 p.m. New York Time) AUSTRALIA At 9:30 p.m. we will have Australian Retail Sales m/m coming out. It is expected to come out at between 0.0% and 0.1%. If it comes out at 0.5% or higher, I would buy AUD/USD and expect 35 to 40 pips price action. If it comes out at -0.4% or more negative, I would sell AUD/USD and expect 35 to 40 pips price action as well. For additional tips how to trade this trade, please watch the video. If you trade spikes, watch out for possible numbers leaks. Also, watch out for the trade balance and in case of a big conflict, stay away from the market; however, smaller deviation on the trade balance should not be a big deal. Happy Trading!!
Monday, July 28, 2008
at
17:51
|
Let's review what happened on Friday.
UK GDP came out as expected so it was a no trade.
U.S. Core Durable Goods m/m, however, came out much higher than expected: 2.0% versus -0.2%. USD/JPY moved pretty well, almost 40 pips. Well, better skip a good move than lose money on bad move.
U.S. New Home Sales missed our target by 1K so it was a no trade. USD/JPY moved by 20 pips.
On Monday there are no news that I consider tradable.
Happy Trading!!
Thursday, July 24, 2008
at
18:00
|
Let's first review what happened on Wednesday.
At 4:30 a.m. we had BOE coming out. The vote was 8:1 but comments were more hawkish than expected, and GBP was going up greatly.
At 7:00 a.m. we had Canadian CPI. It came out too close to expectations to enter a trade.
At 5:00 p.m. we had a surprise rate cut out of New Zealand. Only 24% of economists expected a rate cut. We saw 84 pips move on NZD/USD. I was hoping for a miracle retracement to enter a trade because this may go down even more. Probably there are more rate cuts coming out by the end of 2008.
Let's talk about Thursday.
1. Thursday, July 24th, 2008 (4:00 a.m. New York Time) GERMANY
At 4:00 a.m. we will have German IFO. It is expected to come out at 100. If it comes out at 101, I would buy EUR/USD. If it comes out at 99, I would sell EUR/USD. In either case, I would expect 30 pips of price action although we saw 60 pips moves on 1 deviation.
2. Thursday, July 24th, 2008 (4:30 a.m. New York Time) UK
At 4:30 a.m. we will have UK Retail Sales m/m coming out. It is expected to come out at -2.6%. We will have to use a bigger deviation than usually use because the expectation range is much wider: it's between -4.0% to +0.5%. Therefore, I would use 1% trigger. If it comes out at -1.6% or less negative (higher) on m/m, I would buy GBP/USD and expect 35 pips price action. If it comes out at -3.6% or more negative (lower), I would sell GBP/USD and expect 35 pips move as well. Last month with much bigger deviation we had 65 pips move so if it is going to deviate by much more than just 1%, we might see much bigger move.
3. Thursday, July 24th, 2008 (10:00 a.m. New York Time) USA
At 10:00 a.m. we will have U.S. Existing Home Sales coming out. It is expected to come out at 4.94M. If it comes out at 5.04M, that would be good for the U.S. dollar, and USD/JPY should be moving by 40 pips. If it comes out at 4.84M or lower, I would sell USD/JPY and expect 40 pips price action as well. This may work better than it was performing in the past, and any positive deviation may be appreciated by the market.
4. Thursday, July 24th, 2008 (7:30 p.m. New York Time) JAPAN
At 7:30 p.m. we will have Tokyo CPI. Leave it alone.
Happy Trading!!
Wednesday, July 23, 2008
at
15:29
|
Let's talk about Wednesday.
1. Wednesday, July 23rd, 2008 (4:30 a.m. New York Time) UK
At 4:30 a.m. we will have BOE and the vote is expected 8:1 for no change. If you are new in Forex, don't trade it. If you want to trade it, watch the video.
2. Wednesday, July 23rd, 2008 (7:00 a.m. New York Time) CANADA
At 7:00 a.m. we will have Canadian CPI Core m/m which is expected to come out at 0.1%. If it comes out at 0.3% or higher, I would sell USD/CAD and look for 40 pips move. If it comes out at -0.1% or lower, I would buy USD/CAD and expect 40 pips as well. Bank of Canada may react on higher inflation so I think this may create more long term move.
3. Wednesday, July 23rd, 2008 (5:00 p.m. New York Time) NEW ZEALAND
At 5:00 p.m. we will have Interest Rate statement out of New Zealand. It is expected they will hold the rates at 8.25%. If it comes out at 8.00% or lower, I would sell NZD/USD and look for 50 pips price action. If they hike the rates, I would buy NZD/USD and expect 50 pips move. If they hold the rates at 8.25%, NZD/USD may go up a little and you may want to scalp a few pips but be extremely careful.
Happy Trading!!
Friday, July 18, 2008
at
13:23
|
Let's talk about Friday.
1. Friday, July 18th, 2008 (2:00 a.m. New York Time) GERMANY, EURO ZONE
At 2:00 a.m. we will have German PPI. We had a pretty good move last month - 40 pips in first 40 minutes but eventually EUR/USD moved by 140 pips. If this comes out shocking, we might have a nice trade. I will be trading PPI m/m. If it expected to come out at 0.7%. If it comes out at 1% or higher, I would buy EUR/USD and expect 30 pips move although the move might be very slow. If it comes out at 0.4% or lower, I would sell EUR/USD and expect 30 pips move as well.
That's all for this week.
Thursday, July 17, 2008
at
18:34
|
Let's review what happened on Wednesday.
At 4:30 a.m. we had UK Claimant Count Change which came out higher than expected which was bad for GBP. We saw 35 pips spike down and eventually the price went down even more.
At 8:30 a.m. we had U.S. CPI Core. My strategy was to enter an opposite trade right on the spike. We only had 25 pips spike down and it went up past pre-release. Since the spike was so little, most likely you missed long entry which is good because at least you did not lose money on the spike, and with missed entry you did not make anything so no gain and no loss is not that bad.
At 9:15 a.m. we had U.S. Industrial Production. It came out 0.5% versus 0.1%, not enough to buy on USD/JPY. No trade here.
Let's talk about Thursday.
1. Thursday, July 17th, 2008 (8:30 a.m. New York Time) UK
At 8:30 a.m. we will have U.S. Housing Starts and Building Permits. I think it is better to focus on Housing Starts. When Housing Starts deviated by over -60K, we saw only 15 pips move on USD/JPY and then it went the other way. However, when it deviated by +90K two months ago, we saw nearly 40 pips spike up and the price eventually went even higher. Today Housing Starts m/m is expected to come out at 960K. If it comes out at 1,000K or higher, I would buy USD/JPY and expect 35 pips price action. If it comes out at 920K or lower, I would sell USD/JPY and look for 30 pips price action. (I, Crazy Cat, however will not be trading negative deviation at all, only positive).
2. Thursday, July 17th, 2008 (10:00 a.m. New York Time) USA
At 10:00 a.m. we will have Philadelphia Fed Index coming out. It is expected to come out at -15. If it comes out at -25K or more negative, I would look to sell USD/JPY and expect 30 pips price action. If it comes out at -5K or less negative, I would buy USD/JPY and expect 30 pips move as well.
3. Thursday, July 17th, 2008 (10:30,11:15 a.m. New York Time) CANADA
At 10:30 we will have Monetary Policy out of Bank of Canada and at 11:15 we will have a speech. We can see a good/bad reaction on the Canadian dollar. Watch out.
Happy Trading!!
Wednesday, July 16, 2008
at
17:45
|
Let's first review what happened on Tuesday.
At 4:30 a.m. we had UK CPI and we were going to trade against it. This strategy worked perfectly well. We had nearly 50 pips spike up and then we had price reversal. We made a good money on this news.
German ZEW came out much lower than expected and it behaved similarly to the UK report. Price spiked down by over 30 pips and the price reversed.
At 8:30 a.m. we had a few U.S. reports. U.S. Retail Sales came out too close to expectations so it was a no trade.
Canada did not change rates so it was a no trade.
We had a very interesting price action during Bernanke speech. Please watch the video for more details.
Let's talk about Wednesday.
1. Wednesday, July 16th, 2008 (4:30 a.m. New York Time) UK
At 4:30 a.m. we will have U.K. Claimant Count Change which is expected to come out at 10. I would trade it with 5 deviation. If it comes out at 15 or higher, this would be bad for GBP so I would sell GBP/USD and expect 30 pips price action. If it comes out at 5 or lower, it would be good for GBP and I would buy GBP/USD and look for 30 pips as well. We will also have Average Earnings Index and if this comes higher it is good for GBP and if it comes out lower it is bad for GBP. 0.3 deviation would be significant but over time the focus has been shifted from Average Earning Index to Claimant Count Change although avoid conflicts here.
2. Wednesday, July 16th, 2008 (5:00 a.m. New York Time) UK
At 5:00 a.m. we will have CPI out of Euro zone. This one is not tradable (because this is a final revision).
3. Wednesday, July 16th, 2008 (8:30 a.m. New York Time) USA
At 8:30 a.m. we will have U.S. CPI. LIke with the U.K CPI, we might see a nice spike up but we may also see a nice retracement so you may want to sell a potential top (or buy a potential low). Inflation itself is bad for the U.S. dollar although hiking interest rates would be good for the U.S. dollar. That's why CPI is tricky to trade. Because of that, there are no official triggers although if Core CPI m/m comes out at 0.3 or higher, you may try to cash fast profit on sell EUR/USD or GBP/USD but get out quickly after 35 to 50 pips move and reverse your transaction. If it comes out at 0.1 or lower, you might want to buy GBP/USD or EUR/USD and reverse as soon as the price moved 35 to 50 pips. My main focus will be on entering the opposite direction, not spike entry. If there are conflicts, it should help to turn it around. Please watch the video for more details.
4. Wednesday, July 16th, 2008 (9:00 a.m. New York Time) USA
At 9:00 a.m. we will have U.S. TIC coming out. This might be tradable but I would like to see this report performing better before trading it on my own account. I will not be trading it.
5. Wednesday, July 16th, 2008 (9:15 a.m. New York Time) USA
At 9:15 a.m. we will have U.S. Industrial Production. It is expected to come out at 0.1%. If it comes out at 0.6% or higher we might see 15 pips price action so you may want to buy USD/JPY for a quick scalp if spread was very small. If it comes out at -0.4% or lower, you may want to sell USD/JPY and expect 15 pips move as well. Because profit target is so small, this will not work if your broker raises spread so officially it is a no trade.
Happy Trading!!
Tuesday, July 15, 2008
at
14:41
|
Let's talk about Tuesday.
1. Tuesday, July 15th, 2008 (4:30 a.m. New York Time) UK
At 4:30 a.m. we will have UK CPI coming out. This indicator has been acting strangely. Last month we had +0.2 deviation so GBP/USD should have been going up but it actually spiked up by 30 pips and then it went the other way. Two months ago it spiked up by 50 pips and went the other way. Three months ago we saw 40 to 50 pips move and again it went the other way. Probably one way to approach it is to trade against it, that is wait when it moves 40 to 50 pips and enter a position with opposite direction. Why? Please watch the video for the detailed explanation. Because of that, there are no triggers for this report.
2. Tuesday, July 15th, 2008 (5:00 a.m. New York Time) GERMANY
At 5:00 a.m. we will have German ZEW coming out. This moves pretty well. If the number comes out much worse then expected, EUR/USD may go down by 35 to 50 pips but expect a big retracement as well. If it comes out at -60 or more negative, sell EUR/USD but look to get out pretty quickly because most likely it will retrace. If it comes out at -50 or less negative, it is going to be first better-than-expected number since March. On March we had a steady price action. Most likely people will be very surprise so I would expect 50 pips move up but take some profit once you are in profit just in case it would retrace.
3. Tuesday, July 15th, 2008 (8:30 a.m. New York Time) USA
At 8:30 a.m. we will have a few U.S. indicators coming out. I will be trading U.S. Retail Sales X Autos (Core) which is expected to come out at 1.0%. With 0.5 deviation you can expect 30 pips at most, and probably there will be a big reversal. If it comes out at 1.6% or higher, that would should be good for USD/JPY and I would buy USD/JPY and look for 30 pips price action but be very careful. If it comes out at 0.4% or lower, that would be bad for the U.S. dollar and I would sell USD/JPY and look for 30 pips price action. Before the trade, look for support/resistance levels and don't try hard to break them if the price does not want to break them. If there is a big conflict with PPI, stay away or exit quickly. PPI should not be a big deal unless there is a big conflict.
4. Tuesday, July 15th, 2008 (9:00 a.m. New York Time) CANADA
At 9:00 a.m. we will have Canadian Interest Rate statement. It is expected they will keep the rates unchanged at 3.00%. If they hike the rates to 3.25%, I would sell USD/CAD and look for 70 pips price action. If they lower the rates to 2.75%, I would buy USD/CAD and look for 70 pips price action as well. They will also release a statement so this might move USD/CAD sharply.
5. Tuesday, July 15th, 2008 (10:00 a.m. New York Time) USA
At 10:00 a.m. there will be Bernanke's testimony released. I would trade it on EUR/USD but if you are new, stay away from it. If interested in trading it, please watch the video.
Monday, July 14, 2008
at
12:04
|
Let's talk about Monday.
1. Monday, July 14th, 2008 (4:30 a.m. New York Time) UK
At 4:30 a.m. we will have UK PPI. It is hard to give any specific triggers here. This trade performs very differently depending on the economic situation. Also, there is a great possibility of a conflicting numbers. When they all agree, the price action is pretty good but when we see some conflicts, then this may get more complicated. If all PPI came out higher or lower than expected by 0.5, we should see GBP/USD moving by 40 pips easily.
2. Monday, July 14th, 2008 (6:45 p.m. New York Time) NEW ZEALAND
At 6:45 p.m. we will have New Zealand CPI coming out. I would focus on the q/q number which is expected to come out at 1.4%. If it comes out at 1.7%, I would buy NZD/USD and look for 35 pips move. If it comes out at 1.1% or lower, I would sell NZD/USD and expect 35 pips price action as well. There might be a very quick spike so be careful.
3. Monday, July 14th, 2008 (7:01 p.m. New York Time) UK
At 7:01 p.m. we will have UK RICS House Price Balance. I would leave it alone. If it deviates a lot, we might see 25 pips move but this is very risky report to trade.
4. Monday, July 14th, 2008 (9:30 p.m. New York Time) AUSTRALIA
At 9:30 p.m. we will have RBA Minutes out of Australia. This is not for beginners so if you are new in Forex, skip it. If you are interested in trading it, please watch the video.
That's all for Monday.
Wednesday, July 9, 2008
at
14:41
|
Let's talk about Wednesday.
1. Wednesday, July 9th, 2008 (4:30 a.m. New York Time) UK
At 4:30 a.m. we will have UK Trade Balance. This is not tradable. Even with a big deviation last year it failed to perform.
2. Wednesday, July 9th, 2008 (5:00 a.m. New York Time) EURO ZONE
At 5:00 a.m. we will have GDP out of Euro zone. I am not expecting any big moves on it and I will skip it as well.
3. Wednesday, July 9th, 2008 (10:35 a.m. New York Time) USA
At 10:35 a.m. we will have Crude Oil Inventories coming out of U.S. It is expected to come out at -2100 K. If it comes out at 0 or positive, that would move a stock market amy go up and U.S. dollar may appreciate so EUR/USD or GDP/USD should go down by about 20 pips, and USD/JPY may go up by 20 pips. If it comes out low at -4000K or more negative, USD/JPY may go down and EUR/USD and GBP/USD may go up by about 20 pips. Make a good judge which pair to trade before the news.
4. Wednesday, July 9th, 2008 (9:30 p.m. New York Time) AUSTRALIA
At 9:30 p.m. we will have Australian Employment Change coming out. It is expected to come out at +10K. If it comes out at -5K or more negative, I would sell AUD/USD and look for about 40 pips price action. If it comes out at +25K or higher, I would buy AUD/USD and look for 40 pips price action as well. Please watch the video for more details.
That's all for Wednesday.
Tuesday, July 8, 2008
at
12:25
|
Let's first review what happened on Monday.
At 4:30 a.m. we had UK Industrial Production which came out much lower than expected: -0.8% versus -0.1%. At that time GBP/USD was oversold y 120 pips so the spike itself was not big. Eventually it moved more pips but this was very creepy to trade.
At 6:00 a.m. we had German Industrial Production which came out -2.4 versus 0.3 expected. It was a huge deviation, and EUR/USD moved by about 30 pips but it also retraced by over 100%. I was watching it live but I did not trade it.
At 8:30 a.m. we had Canadian Building Permits which came out at 1.1% versus -5.8% expected. We should see some positive price action but what we saw was just 10 pips. It seems this indicator is pretty much dead.
Let's talk about Tuesday.
1. Tuesday, July 8th, 2008 (8:00 a.m. New York Time) USA
At 8:00 a.m. Bernanke will be speaking. They are expecting him to be hawkish so any good confirmation of this tone should be U.S. dollar supportive and you should see EUR/USD and GBP/USD going down. If he is more neutral, we can easily see a lot of strength on EUR/USD or GBP/USD. Don't trade it if you are new in Forex, and for more details please watch the video.
2. Tuesday, July 8th, 2008 (10:00 a.m. New York Time) USA
At 10:00 a.m. we will have U.S. Pending Home Sales which is the least tradable Home Indicator. I will not be trading it.
Monday, July 7, 2008
at
13:19
|
Let's first review what happened on Friday.
At 6:00 a.m. we had German Factory Orders which deviated pretty well but there was no market reaction at all.
At 10:00 a.m. we had Canadian Ivey PMI coming out which came out 69.6 versus 62.25 expected. There was very little price action but if you trade it, you should be able to get out at BE.
Let's talk about Monday.
1. Monday, July 7th, 2008 (4:30 a.m. New York Time) UK
At 4:30 a.m. we will have UK Industrial Production m/m coming out which is expected to come out at -0.1%. I would recommend to use at least 0.3 trigger either direction. Last time we had +0.2 deviation GBP/USD spiked up by 15 pips and then it went the other direction. If it comes out at +0.2% or higher, I would buy GBP/USD and look for 30 pips price action. If it comes out at -0.4% or more negative, I would sell GBP/USD and look for 30 pips move as well.
2. Monday, July 7th, 2008 (6:00 a.m. New York Time) GERMANY
At 6:00 a.m. we will have German Industrial Production. It is not tradable at this moment.
3. Monday, July 7th, 2008 (8:30 a.m. New York Time) CANADA
At 8:30 a.m. we will have Canadian Building Permits m/m coming out. Last month with a big trigger it failed to move at all. I would consider skipping it but if you really want to trade it, I would sell USD/CAD if it comes out at 0 or positive. If it comes out at -11 or more negative, this might be quite a good signal and I would buy USD/CAD and expect 25 pips move. But again, I am not sure if it is going to work well.
That's all for Monday.
Happy Trading!
Sunday, July 6, 2008
at
18:13
|
Let's first review what happened on Thursday, 3-July-'08.
At 3:30 a.m. we had Swedish Interest Rate Statement. We got a sell signal on EUR/SEK. The price moved down by about 350 pips, retraced by 50%, and then it moved another 400 pips although that 400 pips move down was also because of Trichet speech.
At 4:30 a.m. we had UK Services PMI which was a big number here. It came out at 47.1 versus 49.5. GBP/USD went down by 30 pips but that was it, we did not have any following price action.
At 7:45 a.m. we had Euro Interest Rate Statement. The plan was to sell whether there was a hike or not (on hike signal sell as soon as there was a spike up). It worked pretty well. I hope you made some money.
At 8:30 a.m. we had Non-Farm Payroll coming out which came out very close to expectations. The unemployment came out a little worse, and Initial Jobless Claims came out a little higher was well but the market reacted very well as people were expecting much worse data. After the initial spike down, USD/JPY started going up very fast. One of the reason the dollar was a king was Trichet's speech.
At 8:35 a.m. we had Trichet speaking. Amazing move and we made tons of pips. It seems we handle such speeches very well in the Diamonds room. Please watch the video the detailed comment.
At 10:00 a.m. we had ISM Non-Manufacturing coming out. It came out much worse than expected: 48.2 versus 51 expected. USD/JPY went down by 30 pips and totally reversed then. I got fooled with such big deviation and tried to enter on the retracement so I lost a little on this report. I should had followed my own advice although the deviation was really big.
Let's talk about Friday, 4-July-'08.
With 4th of July holiday in the United States, I think a lot of traders all around the world will take a day off, especially since it is Friday, the last working day of the week. Therefore, currencies may trade sideways or we may see creepy moves on or the other direction that normally would not happen. I will be taking a day off as I am not sure if we are going to see 10 pips or 100 pips reaction on the news announcements. If you want to trade, you may give a try but be advised that anything can happen today.
1. Friday, July 4th, 2008 (6:00 a.m. New York Time) GERMANY
At 6:00 a.m. we will have German Factory Orders. This may move EUR/USD a little, some people trade it with a success before but because of the holiday I don't have any specific triggers here. Just be aware that EUR/USD may do spikes at 6:00 a.m.
2. Friday, July 4th, 2008 (10:00 a.m. New York Time) CANADA
At 10.00 a.m. we will have Canadian Ivey PMI. If you want to trade it, you may try to scalp with 3.0 trigger. Last month with 3.5 deviation USD/CAD moved by 25 pips so it was not a big move. Therefore, 3.0 trigger might be good enough to scalp a few pips so if it comes out at 65.3 or higher, you may try to sell USD/CAD, and if it comes out at 59.3 or lower, you may try to buy USD/CAD. We may see a nice move or ugly move here depending on how many people will be trading so obviously if the price is moving, you may try to some of the close positions as the price is moving. If the price is not moving, don't go under the water with this little report and get out at BE or small loss.
That's all for this week.
Thank you and good luck with your trades.
Happy Trading!
It's been a while, I was kept away from the markets for a while, then after that deliberately hid away. Trading can be a taxing endeavour (in both senses of the word), the market is a real moody beast, and any guy that is married will know, pay attention to those that are moody! It was because of this I had to step back, stop writing here, halt the alerts for a while, stop updating beginnertrader.com unless someone else contributed and just take stock, I wasn't paying attention.

One of my weaknesses is over-exuberance, not really outwardly if you meet me in person, quite a calm fellow really, but inside my head many an idea will spawn. Sometimes it take a smack over this same head to realise when I am doing too much, in this case, a couple of weeks of poor trading (not losing weeks .. just but poor trading weeks) did the trick. My entries were early, my exits were late, my decisions rushed and my big toe hurt to buggery thanks to another over-exuberant teammate on the soccer field.
So I took some time off .. stepped away from the markets, did some reading and got back to the basics. I didn't even bother trading demo accounts or paper trading, instead I got outside, played some sport, spent some time with the better half and mini me, and just got away from it all. The result? ... a +450 pip week this week and a much clearer mind. Everything is about balance, good old Newton told us that way back when, so you would think we would have got it by now.
"Screen time" as it is called around the web (i.e. staring at charts for extended periods), is beneficial, don't get me wrong, getting the repeatable patterns into the subconsience can help, but once screen time becomes, mindless staring, it is probably time to shut the trading platform and take an extended break.
For me I knew I had reached that point when my trading behaviour became very sloppy, for others it could be when you start visiting the Oprah website, or start thinking Porn sites are educational, and you go there only for the articles. Whatever the sign is, drag your tired, bloodshot eyes from the screen and get some sunshine, it is a wonder what the outside world contains, and believe me you'll trade better for it.
Happy Trading!
Friday, July 4, 2008
at
19:26
|
The question quite often comes up about when are the best times to trade? Everyone has their own ideas on what they think is the best time to trade, and quite often it depends on what type of system you are using. If you run a system that looks for trends, the best time for you would be different for a system looking for breakouts.
Rather than get into all that however (again just google "best forex trading times" for plenty of info on that) let's look at the best times to trade based on your experience instead.
A beginner, I would think, would be someone new to the forex markets, someone who has yet to fully develop their trading system, or, if they have, find it hard to maintain the discipline to stick to it no matter what. Some things that might identify a beginner trade could be:
- Unaware of stop losses
- Unsure of trend identification
- Looking at one timeframe only (probably the 5M or 15M)
- Quick to jump into a trade, slow to get out
- Hazy on when to exit a profitable trade
Please don't think I am talking down to anyone, as some of the above applies to us all at times but these are things that I see encapsulate beginnner traders.
With those points in mind, the safest trading time would be one where:
- The chances of big losses are low
- You have time to think you trades through
- There are some defineable trends to help you out in getting on the right side of the trade
- Sharp, quick movements in the opposite direction to your trade aren't common
The markets can move so quickly, and any trade placed without a stop loss, is open to a sharp reversal and a big loss. Head out for a cup of tea, come back and your +10 could now be -50 by the time the kettle has boiled.
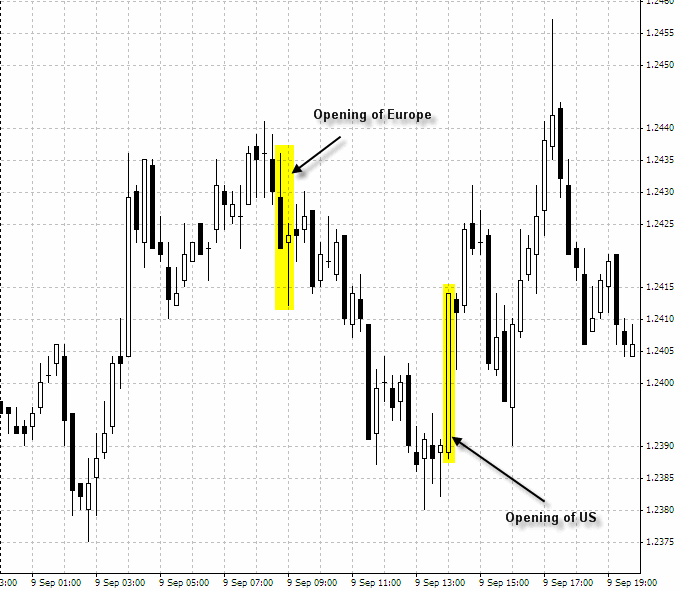
So when is the best time to trade based on the above? Well lets look it another way, what are the times where the above points are not met. My opinion? The opening of the different markets! There are three major markets to look out for, the Asian market, the European market and the US market. The opening and closing of these markets are often the most volatile, with sharp movements up and down with no apparent order quite often seen and many a beginner trader crying foul over a sharp reversal on their trade they have just been watching for the last hour.
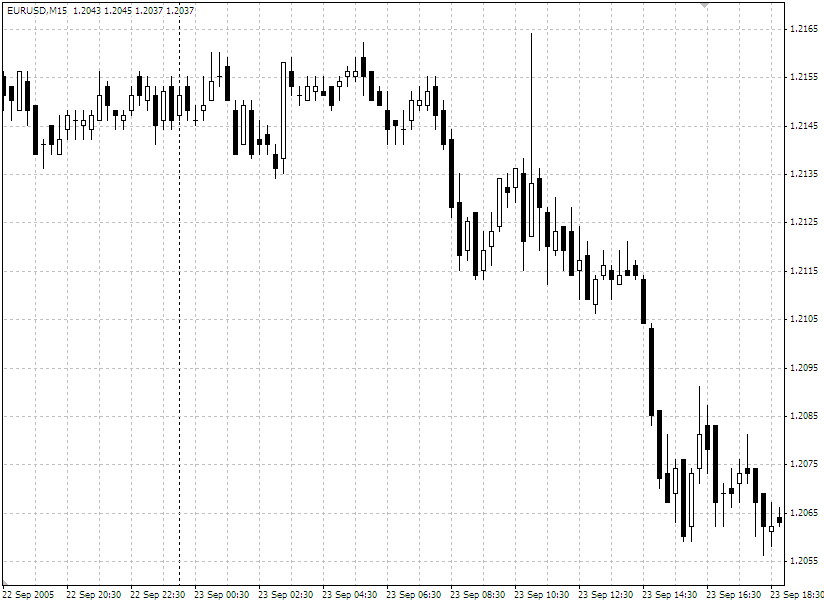
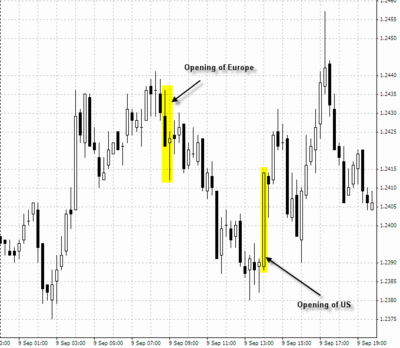 Look at the above chart, this is a 15M chart from late last week of the EUR/USD. I have highlighted two areas, which is the opening of the European and US markets. Notice, how just before the opening of the price was slowly trending in one direction, but then, as the respective markets opened a sharp reversal sprung up in the opposite direction, taking with it many peoples profits I am sure, and spoiling many a traders tea. You find this espectially on the opening of Europe.
The best times for quiet, trending activity tends to be in the middle third of the trading sessions, the middle of the Asian session is a less volatile time, but can be too quiet for some. Approaching the opening of the European sessions, activity tends to pick up, but remember, be careful come opening time. I prefer the mid European session, but rarely get to trade it due to the time differences here in Australia, the mid US session can also be good but usually I am so buggered by that time, my decision making is shocking.
So pick what you prefer, if you are in it for a fast buck and don't care about making it a possible career, then opening and closing times can be right up your ally, but if you want to test out a system you are developing, look at the mid session times that suit you. Remember though news releases and data can effect everything, so always keep an eye out on the news anytime you trade.
Remember, this is not necessarily the most profitable time to trade in terms of pip movement, but while you are picking things up, minimising the chance of your account being wiped out is always a good idea.
I hope this helps someone, you can get the current times in the different areas by using this great little forex clock here. For my fellow countryfolk in Australia, below are the opening and closing times in AEST (thanks to aaron on Marketiva for these):
[AUS open 8:00am close 4:00pm]
[JYP open 10:00am close 6:00pm]
[EUR open 4:00pm close 12:00am]
[GBP open 5:00pm close 1:00am]
[USD open 10:00pm close 6:00am]
Ill leave it with a quote I read somewhere:
"Ametuers open the markets, professionals close them"
... I can't tell you what to trade as much as the next person, essentially you need to make that decision yourself ...
Time for another theory article while the markets are quiet, this time on the first question asked by every new trader I see in the chat rooms, "Can someone tell me what to trade?". Now I can't tell you what to trade as much as the next person, essentially you need to make that decision yourself, not rely on others to tell you what to do, but we can look into how some currency pairs behave to give us a hint into what will suit you.
There are a multitude of currency pairs out there, pick a countries currency, and there will probably be a broker out there trading it, but what we want to look at is the most commonly traded pairs, or the majors as they are refered to. Below is a list of the major currency pairs most commonly offered:
- EUR/USD (Euro/US Dollar)
- GBP/USD (Pound/US Dollar)
- USD/CHF (US Dollar/Swissy)
- USD/JPY (US Dollar/ Yen)
- AUD/USD (Australian Dollar/US Dollar)
- USD/CAD (US Dollar/Canadian)
 Now what do you notice is the common theme through them all? Yep the USD, all the majors either have the USD as the base currency or are matched against the USD. You will find the above list will also have the tightest spreads (see Forex 101 for an explanation on spreads) with most brokers, and will have the biggest daily ranges (difference between the daily high and low).
So what to trade?, if you are a beginner trader, without a tested and trusted system in place, it would be best to choose a couple of these pairs only. More than 2 or 3 will more than likely confuse the buggery out of you, and the last thing we need is to trade confused (I live my life confused, so I would rather not trade that way ;)).
The GBP/USD (known as the "cable") is very popular amongst traders as it tends to have the highest daily range, giving up more pips in it's moves than any other on average. The EUR/USD is also popular as it tends to have the smallest spread with most brokers, why the USD/CHF is another that has some substantial movements.
... as you trade you will start to notice the relationship between the different majors ...
Quite often which pairs you choose might be to do with when you trade. If you tend to trade the asian session the most, the pairs that include asian or oceania currencies would be a good choice such as the USD/JPY, AUS/USD or even, while not a major, the NZD/USD. Those trading the european session of course might choose teh EUR/USD or the GBP/USD, which just about all the majors are ok to trade during the US session.
As you trade you will start to notice the relationship between the different majors, such as how the EUR/USD and GBP/USD tend to mimmick each other, and that if the EUR/USD is going down, then more than likely the USD/CHF is going up. This of course is because they both have the USD as part of their pairing, so if the USD is getting stronger, the EUR/USD will be moving down (Euro getting weaker against a strengthening USD) and the USD/CHF moving up (USD strengthening against the Swissy).
The only exceptions to this relationship will be when country specific news is released, such as a good economic meter reading in switzerland might move the USD/CHF but not the GBP/USD and so forth.
Whichever you choose, there is money to made and lost just as quickly, so be sure to keep your money management tight and your head clear.
Happy trading!
Time for a new theory article, this time on a very basic, but incredibly usefull tool of trend lines. Now for Marketiva users, at present you cannot draw freehand trend lines on their charts, but I have it on good authority that this feature is not too far away, so you may need to look at some online charts or other charting packages to use this tool.
Trend lines form the basis of my trading system presently (along with support and resistance lines), and can give you a good insight into where prices are going, and in which direction. They can also be used to see when a trend might be breaking but I'll go into that a little later.
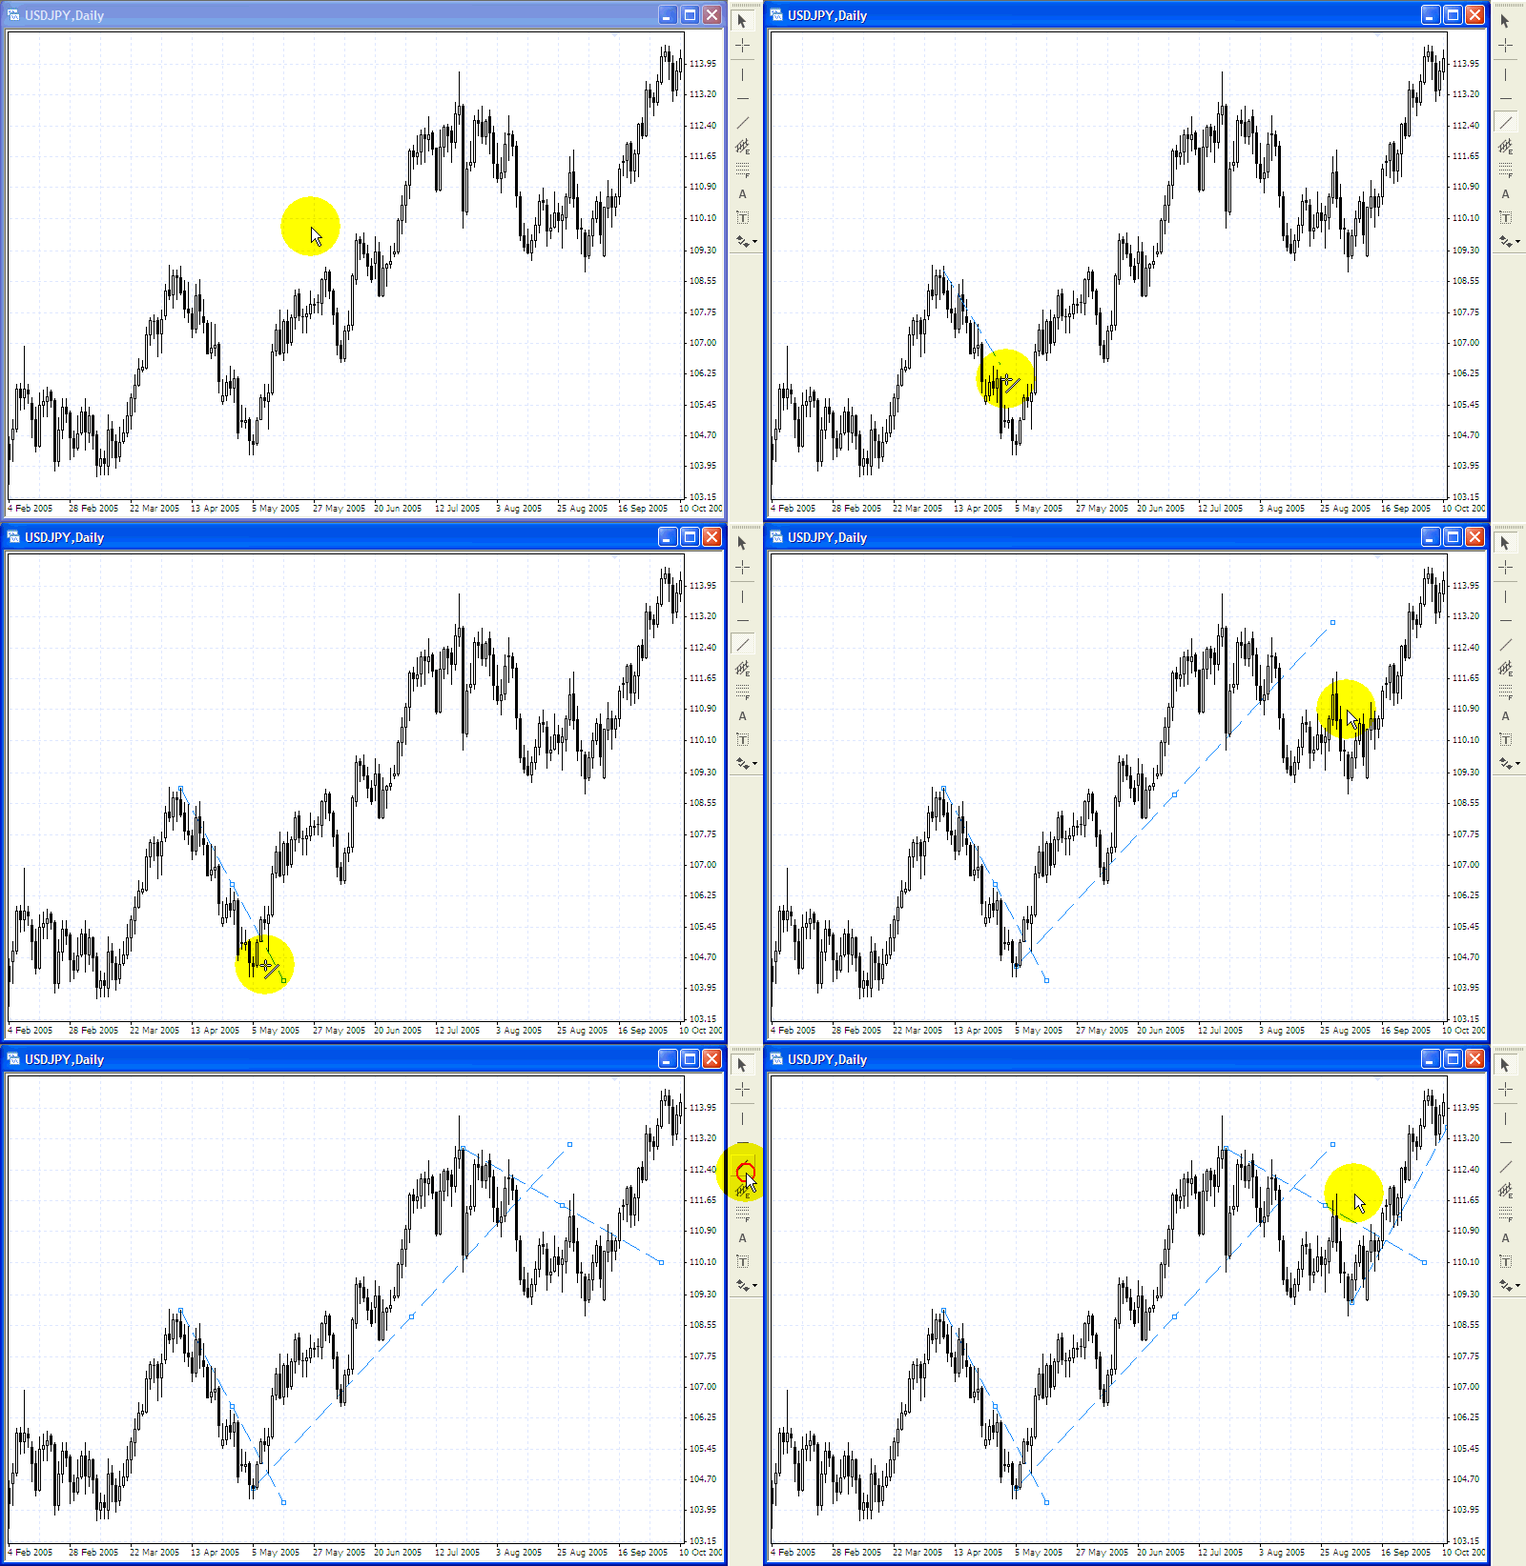
Ok first a chart from Friday just gone (click on it to see the animation):
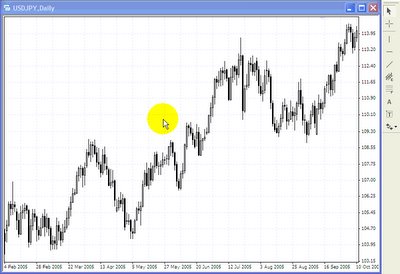
What you seeing here (click on the thumbnail to see it animate) is the USD/JPY daily chart, and on it I am drawing four different trend lines. In a down trend, i.e. when the price is making lower lows, and preferable lower highs, you draw your trend line across each peak, the opposite applies for an uptrend, where you draw a line across the troughs. Look at the above chart to see what I mean.
... never consider a break of a trend line to be valid unless the prices closes outside the trend line ...
The basis of trend line studies, is to see what the overall trend is, and also to identify areas were the trend may be failing. In the above chart, there are four areas where a trend line was broken, in this case, you can see clearly that for a time the price then moved in the other direction, netting a very tidy profit if you read your exit correctly. Another way to trade using the trend lines is to use them to identify where the price may turn back towards the underlying trend, especially if it coincides with a support or resistance level, or a fibonacci line.
Now granted, that every trend line break does not prove to be valid, so be sure to confirm it with other tools, and I never consider a break of a trend line to be valid unless the prices closes outside the trend line on the timeframe my trend line was drawn on. You can draw trend lines on any timeframe, and a useful thing to do is draw your trend lines a timeframe or two above what you trade off, for example, if you trade off 1H charts, draw your trend lines from the 4H or daily charts. This will show you the underlying trend, and keep you in the right side of a trade more often than not.
Best of luck with this simple yet effective tool.
Happy trading!
First of all, very sorry about the lack of updates the last couple of days, but would you believe TODAY is the due date of baby Akuma, but of course, I would not be writing this if it was on it's way ;). My trading activity has been very low lately, but Ill be sure to post at least the results soon, but instead, I thought I would put together a new theory article for you all, this time about Fibonacci.
Fibonacci was named after a mathemetician and trained accountant by the name of Leonardo Pisano in the 1100's (ah yes I remember them well ... those were the days). He came up with, amongst other things, a series of numbers that is now referred to as the Fibonacci sequence, where each number is the sum of the two numbers preceding it. Here is the beginning of it, and of course it goes on to infinity:
1, 1 (1+0), 2 (1+1), 3 (2+1), 5 (3+2), 8 (5+3) etc.
Pretty simple huh! ... this guy is famous cause of that simplicity though, which gives us all hope ;). Anyhow from these numbers a whole bunch of ratios can be taken from them, now I'm not going to pretend to understand them, but the main ratios, that are reproduced through the world, in nature, buildings, cells, ice cream ... ok not ice cream ... are:
0.236, 0.50, 0.382, 0.618 ...
There are many more, but these are the main ones to concern us beginner traders, and here is why. Quite often in the liquid markets of Forex, prices respect these levels when they move, meaning, just like Pivot Lines, prices will quite often pause, and more often reverse at these levels. Most charting packages have the ability to add Fibonacci lines to your charts, for example in Metatrader 4 all you do is; if the price was moving down, drag a line from the recent peak, to the most recent bottom and the lines are added for you. Unfortunately Marketiva does not offer them as yet, however here is a chart with them drawn:
 The blue dotted lines are the fibonacci lines that correspond to the ratio's I was talking about. You can see in the move up, that the 38.2 fibonacci line formed the point for the price to reverse its retracement and continue with the trend (support). Of course, any of these lines could have been the points of reversal, but a reversal at the 38.2 line is a good sign that the trend will continue as the retracement was shallow.
The other line that I find most commonly hit is the 61.8 line as shown here:
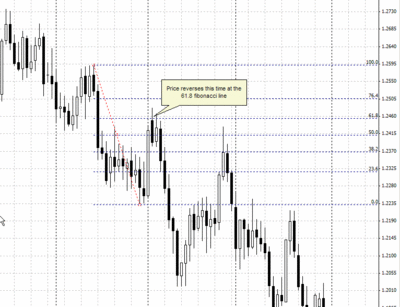
Be a little more wary when such a deep retracement occurs, as it is less likely (although not in the above case) that the previous support will be broken again.
So what do you do with this knowledge? Can you trade with fibonacci alone? In my opinion, no as you don't know which line will be the turning point without the aid of other indicators or reading the price action, but they can be an excellent addition to your trading system to confirm other signals. For example if you have a signal from another indicator telling you a reversal is about to happen, and price is hovering at a fibonacci line, this might give you added confidence to place the trade.
Happy trading!
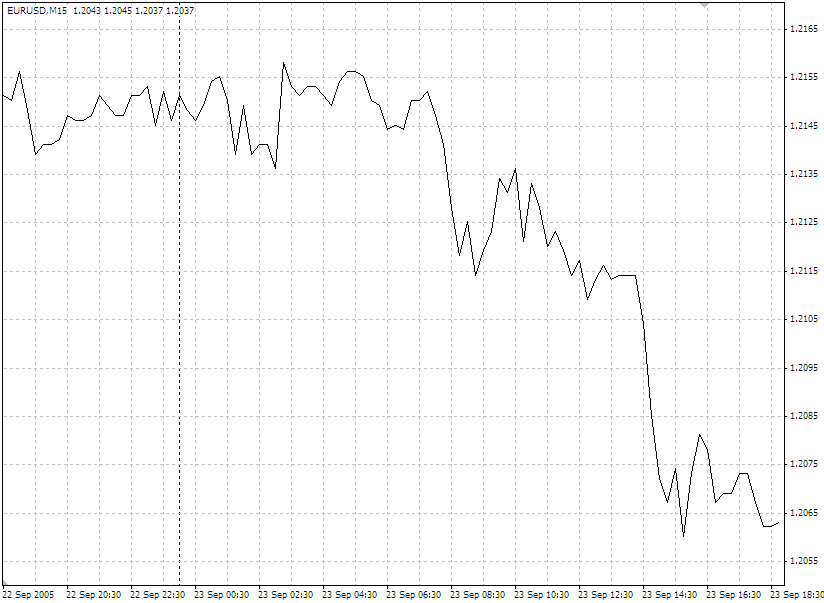
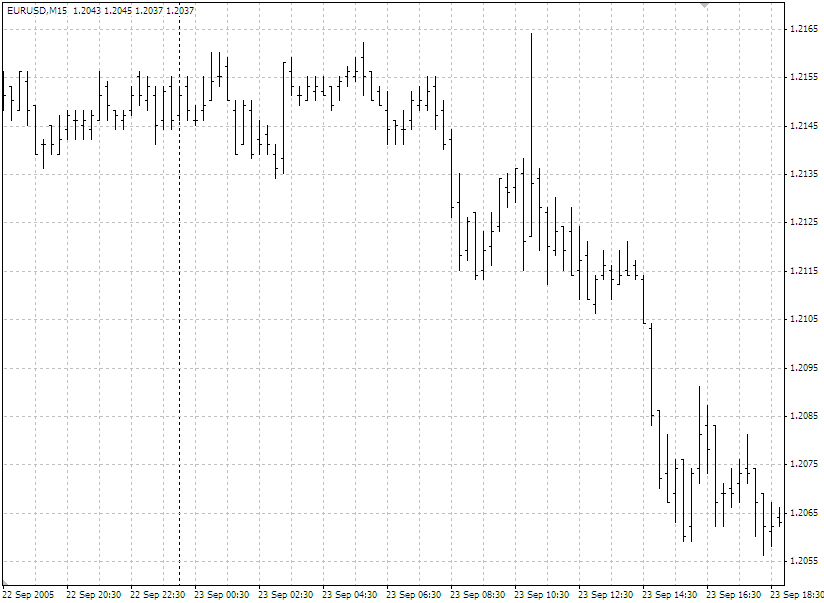
I'll have a quick chat on the theory of Japanese Candlesticks. In case you did not realise, there are three main ways to view a trading chart, you can view it as a line chart, a bar chart, or a candlestick chart. Below are what each of these look like:
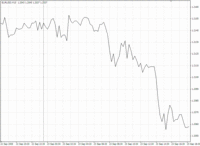 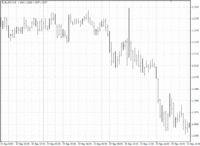 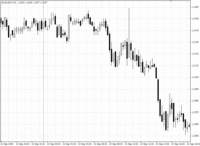
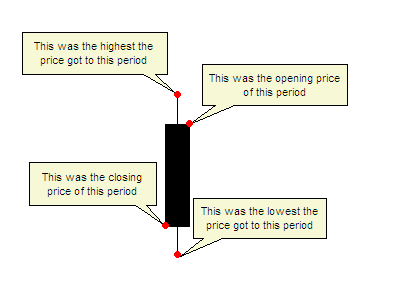
Candlestick's were first introduced in the 1600's, strangely enough to analyze the price of rice contracts. There is no special calculation, they are simply an alternative way of representing current prices. Below is the basic rundown of what a single candlestick looks like, and how it is interpreted.
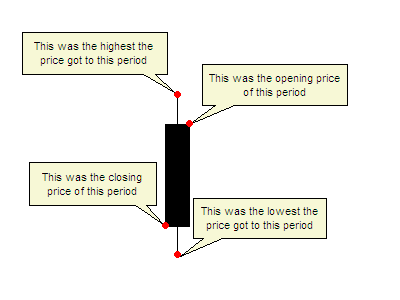 This is a candlestick you would see most often in a downtrend, with the black body being a sign that the closing price finished lower than the opening price.
Here you can see labelled the opening, closing, high and low of the particular period that this candle is representing, which could be 5 minutes, 1 hour or 1 day depending on what chart you are looking at.
Some charts have candles that represent this scenario coloured in red, either way, the main thing is to remember that usually this type of candle will usually be filled.
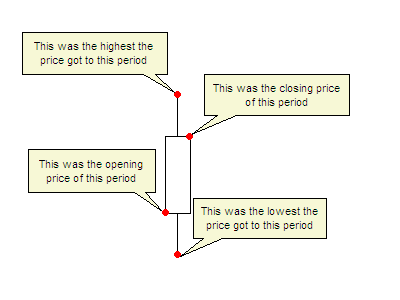
So that is what a "down" candle looks like, a candle representing the opposite scenario, i.e. when the closing price finishes above the opening price usually is white, or uncoloured and looks like below:
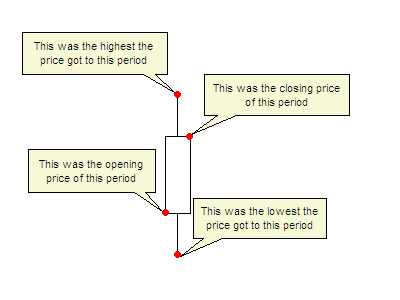 You can see that the main difference between this candle and the above candle is that the closing price is above the opening price, indicating that during this period, the price went up during this period.
Some charting packages will show this candle as a green candle, some as white, or some with no colour at all, just an outline. If you set the colour scheme yourself, just recognise that you need to make this candle different to the above candle so you can distinguish the difference.
Now if I was to run through every type of candle that existed in the theory of candlestick charts, I would more than likely get cramp and brain freeze, and not finish this article. So instead, I will run through some basic deduction you can take from interpreting a few different types of candles.
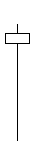
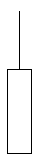 Have a look at this candle (called an inverse hammer), you can see the main difference between this candle and the basic candle I showed you above is the lack of a thin line below body (the thicker white area) of the candle. So what does this mean? The thin lines are refered to as "wicks" or "shadows", and represent when prices move up or down, but are then dragged back.
How to read this candle? Well here the price closed well above it's opening price, there was a push for higher prices as represented by the upper wick, which was pulled back slightly. Depending on the market, you may read this as a sign that price will continue with the upward push, as the price didn't retract too far, and there was no real push for lower prices.
 Ok here is another (called a hammer), the inverse of the previous candle, here you can see the closing price was lower than the opening price, hence the black body of the candle. It has a medium length wick also, which again is a sign that there was a move to push the prices lower. You make this candle to be a sign of strength in a down move, or a sign of a reversal, or pause in an uptrend.
To me the wicks are just as important as the bodies of candles, and should be taken into as much consideration as the colour and length of the body. Now there are a bucket load of different candle types as I mention earlier, but to give you an idea, here are a few that I find to be the most telling when reading candlestick charts.
 This candle is referred to as a "doji", and you can see has very little, or in this case no body to it. This candle is a sign of indicision in the market, as the wicks above and below the non existant body reflect that there was a push up, and a push down, resulting in a stalemate with the opening price and the closing price being the same in the end.
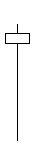
This candle, a hammer, is a strong sign if seen at the bottom of a downtrend, when you suspect that a currency may be oversold. Here you can see a very long bottom wick in comparison to it's body, and tells the story that prices made a strong move down, but was dragged back above it's opening price, hence the white body. A candle with such a long wick as this, is usually a good sign that the momentum of a downward move is stalling or reversing.
 Here you can see a variation on the inverse hammer candle I showed you previously, with the main difference being that this one having a much longer upper wick, and the closing price finished below the opening price. This candle can quite often be a sign of a change in momentum, as the strong push to higher prices, as shown by the long upper wick, was pulled back so far that the prices closed lower, a sign that future pushes to higher prices may be rejected. This candle is especially valid in an uptrend where you may suspect that a currency is overbought.
There are so many more, and I haven't even touched on combining these candles into different formations. I have however, provided a link to an e-book on this subject that covers all the basics in a text book fashion that can be a good reference for you all.
Please do not take this candles as given, like any other indicator, they are just guides that can help you, but it is always safe to look for confirmation either in the next candle or with other indicators. Oh and one last tip, never trade on an incomplete candle, always wait for that period to end before assuming the candle is a certain type. Quite often the biggest moves are at the end of the period you are looking at, and what you thought was one type of candle become something completely different in the matter of seconds.
Best of luck with them, I personally feel candles tell you much more than a line graph ever could, and while bar charts can tell you the same information, I find candlesticks much easier, and more importantly, much faster to read. Please leave a comment if there is something vital I have missed.
Happy trading!
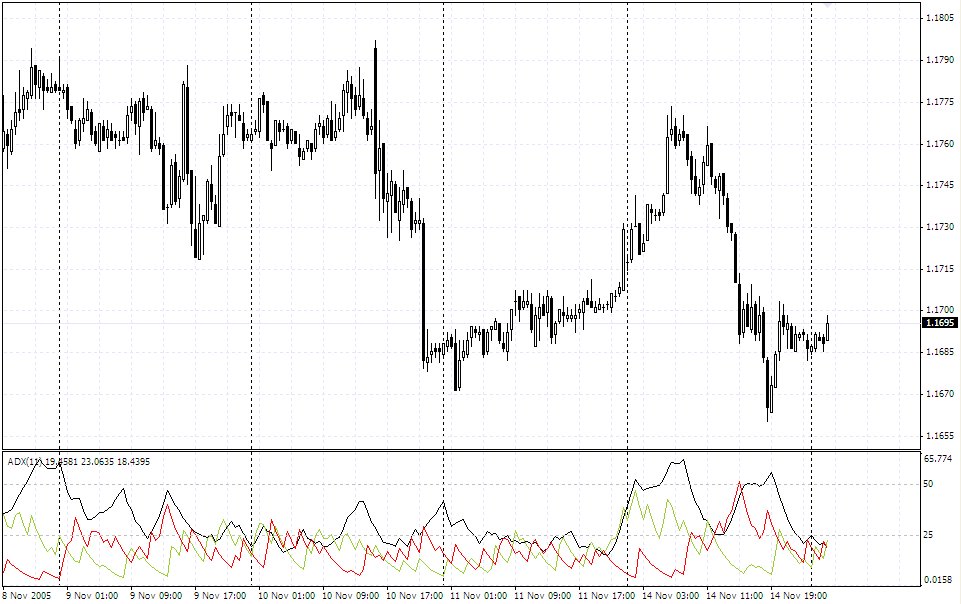
Hi all! Well I have mentioned previously that the only indicator I consistently keep on my charts is an indicator called the ADX, or Average Directional Index (why do they always like using "X" for index .. shouldn't it be "I" ... anyway). I use it primarily to keep me in trades that are moving strongly, and to give me hints on how strong a move actually is.
So, considering I talk about it so often I thought it best to give a general rundown on what the indicator can be used for and how you might be able to use it in your trading system.
The ADX was developed by J. Welles Wilder, yep the same guy who developed the Parabolic and RSI indicators, clever chap that Wilder. Interestingly, Wilder considered the ADX to be his best achievement in terms of indicators, and considering the widespread use of RSI and Parabolics, makes you wonder why more aren't using the ADX (although I am sure plenty are, I have after all only surveyed my next door neighbour and my dog).
First of all let's have a look at what it looks like:
 At first it looks all a little like last night's spaghetti, but really it is quite simple. There are three lines, a trend following line, a positive directional line (+DI) and a negative directional line (-DI). In laymans terms, the black line tracks trends, the red line is a signal line to go short, and the green line a signal line to go long.
First the theoretical way to use it. When the red (-DI) line crosses above the green (+DI) line, it is a signal to go short, and vise versa, green above red is a signal to go long (yep just like Moving Average crossovers). Like all indicators though, there is always lag, and as such I pay little attention to these lines and prefer to get my direction signals of the price action itself. The black line though is something different, it is a line that indicates if a trend is in place. If it rises from below 20 (I use 25) to above 20, it is a sign that a trend is developing and to stick with the trade. While the black line rises, I will always stay with a trade unless there is some news announcement coming up that I am worried about. Once the black line ticks down from above 25, it is a signal for you to assess your position as the run may have come to an end for now.
While such a simple technique (I am all about simplicity), you will be surprised how well it will keep you in those strong moves. So that is it, pretty easy huh ... any questions, just throw me an email or comment here.
Best of luck with it.
Happy trading!
Q: What is Online Forex Trading?
A: Online Forex Trading is a highly attractive marketplace that has a daily volume of $2.5 trillion dollars and has become the largest currency investment arena in the world.

Q: Can anyone send you Forex questions?
A: I will gladly address all your forex questions, in a friendly and simple manner. I will also provide a professional study of the most popular techniques implemented today by Forex traders worldwide. I also hope to offer useful and valuable background, including technical methods, trading tips, Forex glossary, chart reading, and financial indicators used in Fundamental Analysis.
ABOUT THE ONLINE FOREX TRAINING BLOG
As you will see by following my online forex trading blog, my years of experience in Forex trading and Forex platform operation, parallel to Forex education, including seminars, printed publications and academic studies, will help you succeed in Forex too.
It's my goal that my experience be passed on to provide all levels of forex traders the training and the essentials of Forex trading.
With the help of my Online Forex Trading Blog, you will soon be ready to start trading Forex and making all the money you deserve. In fact, you can even start today, while beginning with small amounts and gradually obtaining the experience you need.
I wish you success in your forex trading, and hope you find my Online Forex Trading Blog interesting, helpful and enjoyable.
|
MARVEL and SPIDER-MAN: TM & 2007 Marvel Characters, Inc. Motion Picture © 2007 Columbia Pictures Industries, Inc. All Rights Reserved. 2007 Sony Pictures Digital Inc. All rights reserved. blogger template by blog forum |